
Growth
May 4, 2026
TikTok Audience Targeting Guide for Small Businesses
Learn effective TikTok audience targeting strategies for small businesses to boost engagement, ROI, and brand recognition.


Unlock the potential of TikTok analytics with essential metrics and tools to enhance your content strategy and audience engagement.


TikTok analytics is your key to understanding what works on the platform and how to grow effectively. By tracking metrics like audience demographics, video performance, and engagement rates, you can make data-driven decisions to improve content and reach. Here's what you need to know:
Start by switching to a TikTok Business Account to unlock analytics, and let data guide your content strategy. Whether you're a creator or a brand, this approach can help you maximize TikTok's potential.

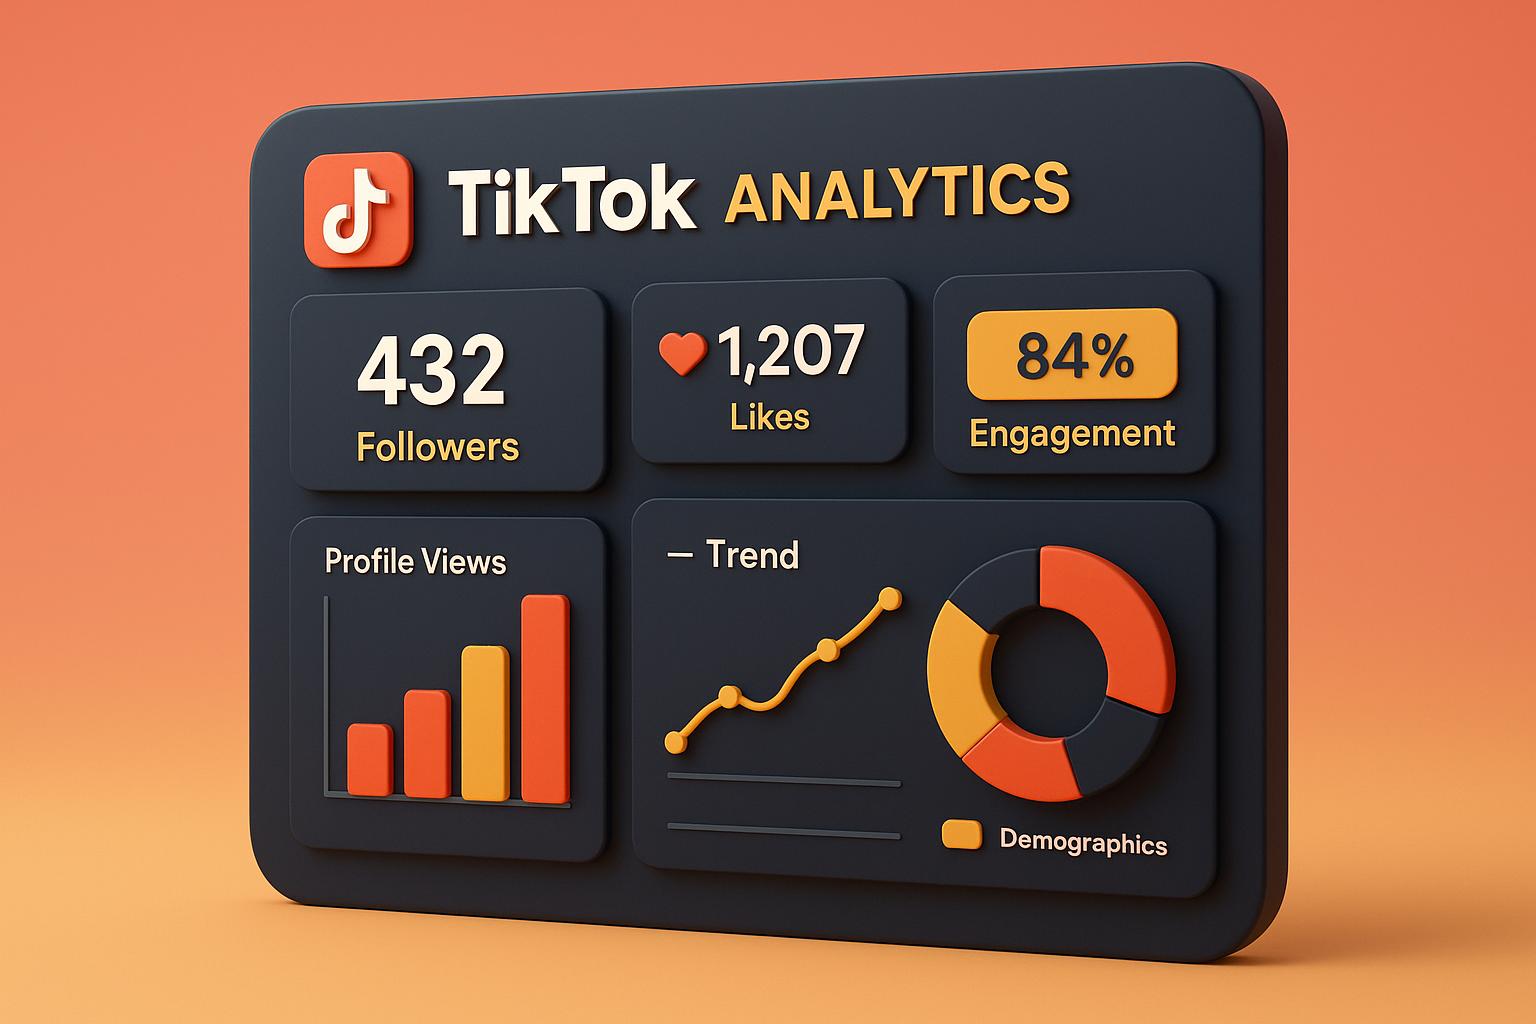
To truly understand your TikTok performance, you need to get comfortable with the platform's analytics dashboard. This tool organizes your data into four main sections - Overview, Content, Followers, and LIVE - each offering insights to help you identify what's working and what could use some tweaking. Let’s break it down.
The Overview section gives you a snapshot of your account's performance. Here, you’ll find metrics like total post views, profile views, likes, comments, shares, and even details about your traffic sources, such as search queries. This is where you can see how far your content is reaching and where your audience is discovering you.
In the Content section, things get more specific. It highlights the performance of individual posts, including your top-performing videos, retention rates, traffic sources for each post, and viewer demographics. Retention rates are especially useful - they show where viewers drop off, helping you identify the most engaging moments in your videos.
The Followers section focuses on your audience. It breaks down demographics like gender, age, top locations, and even peak activity times. This information helps you fine-tune your content and schedule posts to align with when your audience is most active.
For creators who go live, the LIVE section tracks live session metrics. It includes details like the number of live sessions, total views, broadcast duration, new viewers, followers gained during live streams, unique viewers, and diamonds collected. This data offers a roadmap for making your live content more engaging and impactful.
To access TikTok analytics, you’ll first need to switch to a free TikTok Business account. Here’s how: go to your profile, tap the three lines in the top-right corner, select "Settings and privacy", then "Account", and switch to a Business account. Once updated, access the analytics dashboard by tapping the three lines again, selecting "Creator Tools", and then "Analytics".
The dashboard works on both mobile and desktop, but the mobile version is more feature-rich. On mobile, you’ll find tabs for Overview, Content, Followers, and LIVE, with options to view data from the past 7, 28, or 60 days.
In the Content tab, you can sort videos by views, likes, comments, or shares to quickly identify your top-performing posts. Tapping on a specific video reveals detailed insights, including viewer drop-off points, which can help you improve future content.
The Followers tab provides a visual summary of when your audience is most active, highlighting peak days and hours. Use this information to schedule your posts for maximum engagement.
For even deeper insights, consider creating a custom tracking system that combines TikTok’s data with your own metrics. This approach can help you identify which content types drive profile visits or consistently engage viewers through hashtags.
Lastly, don’t forget about TikTok’s Creative Center, which you can access through your browser. This tool offers a broader perspective by showcasing trending hashtags and sounds across the platform. It’s a great way to stay on top of what’s popular beyond your immediate audience.
Up next, we’ll dive into how to access and export these analytics for your records.
TikTok makes it easy to access and export analytics data, allowing you to track performance and create reports tailored to your needs. Whether you're looking for quick insights or automated updates, there are several ways to get the data you need.
First, ensure you have the right account type. A Business Account is required to access TikTok's full analytics features.
To check your account type, go to your profile, tap the three horizontal lines, select Settings and privacy, and then Account. If you see the option Switch to Business Account, you're currently using a Personal Account. If it says Switch to Personal Account, you're already set up with a Business Account.
Once your account is confirmed, you can access TikTok analytics through both the mobile app and desktop browser.
With analytics now at your fingertips, you can move on to exporting the data in a format that works for your reporting needs.
TikTok offers both manual and automated export options, making it easy to tailor your workflow. Data can be exported in CSV or XLSX formats, compatible with tools like Excel and Google Sheets.
For one-off or occasional reports, use the web version of TikTok to manually download data. This method is ideal for monthly or quarterly reporting when real-time data isn't required. Simply download your data as a CSV or XLSX file.
If you need regular updates or manage multiple accounts, automated exports save time and effort. Through TikTok Ads Manager, you can schedule reports to be sent directly to your email.
Reports are typically delivered between 5:00–6:00 AM in your ad account's time zone after processing.
For more advanced reporting, third-party tools can automate TikTok data exports and integrate them with other systems:
Whether you're managing occasional reports or need automated solutions for regular updates, TikTok offers flexible options to suit your workflow and technical needs.
Customizing reports in TikTok Ads Manager helps you turn raw data into insights tailored to your business goals. These reports allow you to focus on the metrics that matter most and share results in formats that resonate with your team or stakeholders.
TikTok Ads Manager offers a custom reporting feature that helps you organize and analyze data to uncover trends and patterns. To create a custom report, go to the Analytics menu, select Custom reports, and click on Create Custom Report. From there, choose dimensions and metrics that align with your performance goals, such as CPM, CPC, CTR, and CVR.
For reference, TikTok's average CPM typically falls between $3.20 and $10, while CPC ranges from $0.25 to $4. You can also set the time range for your report - options include yesterday, the last 7 days, the last 30 days, or a custom date range. Decide whether a pivot table or trend line format will best showcase your data. Once everything is set, save the report with a descriptive name for easy reference.
To make your custom reports even more effective, tailor them to your specific marketing objectives. For example:
With TikTok's massive user base of 1 billion active users each month, these tailored reports can give you a deeper understanding of your audience and help refine your strategy.
Up next, learn how AI-powered tools can elevate these insights and drive your growth efforts.
TikTok's built-in analytics provide some solid insights, but AI-powered tools take things to another level. They dig deeper, uncover patterns, and suggest actionable strategies to help you grow.
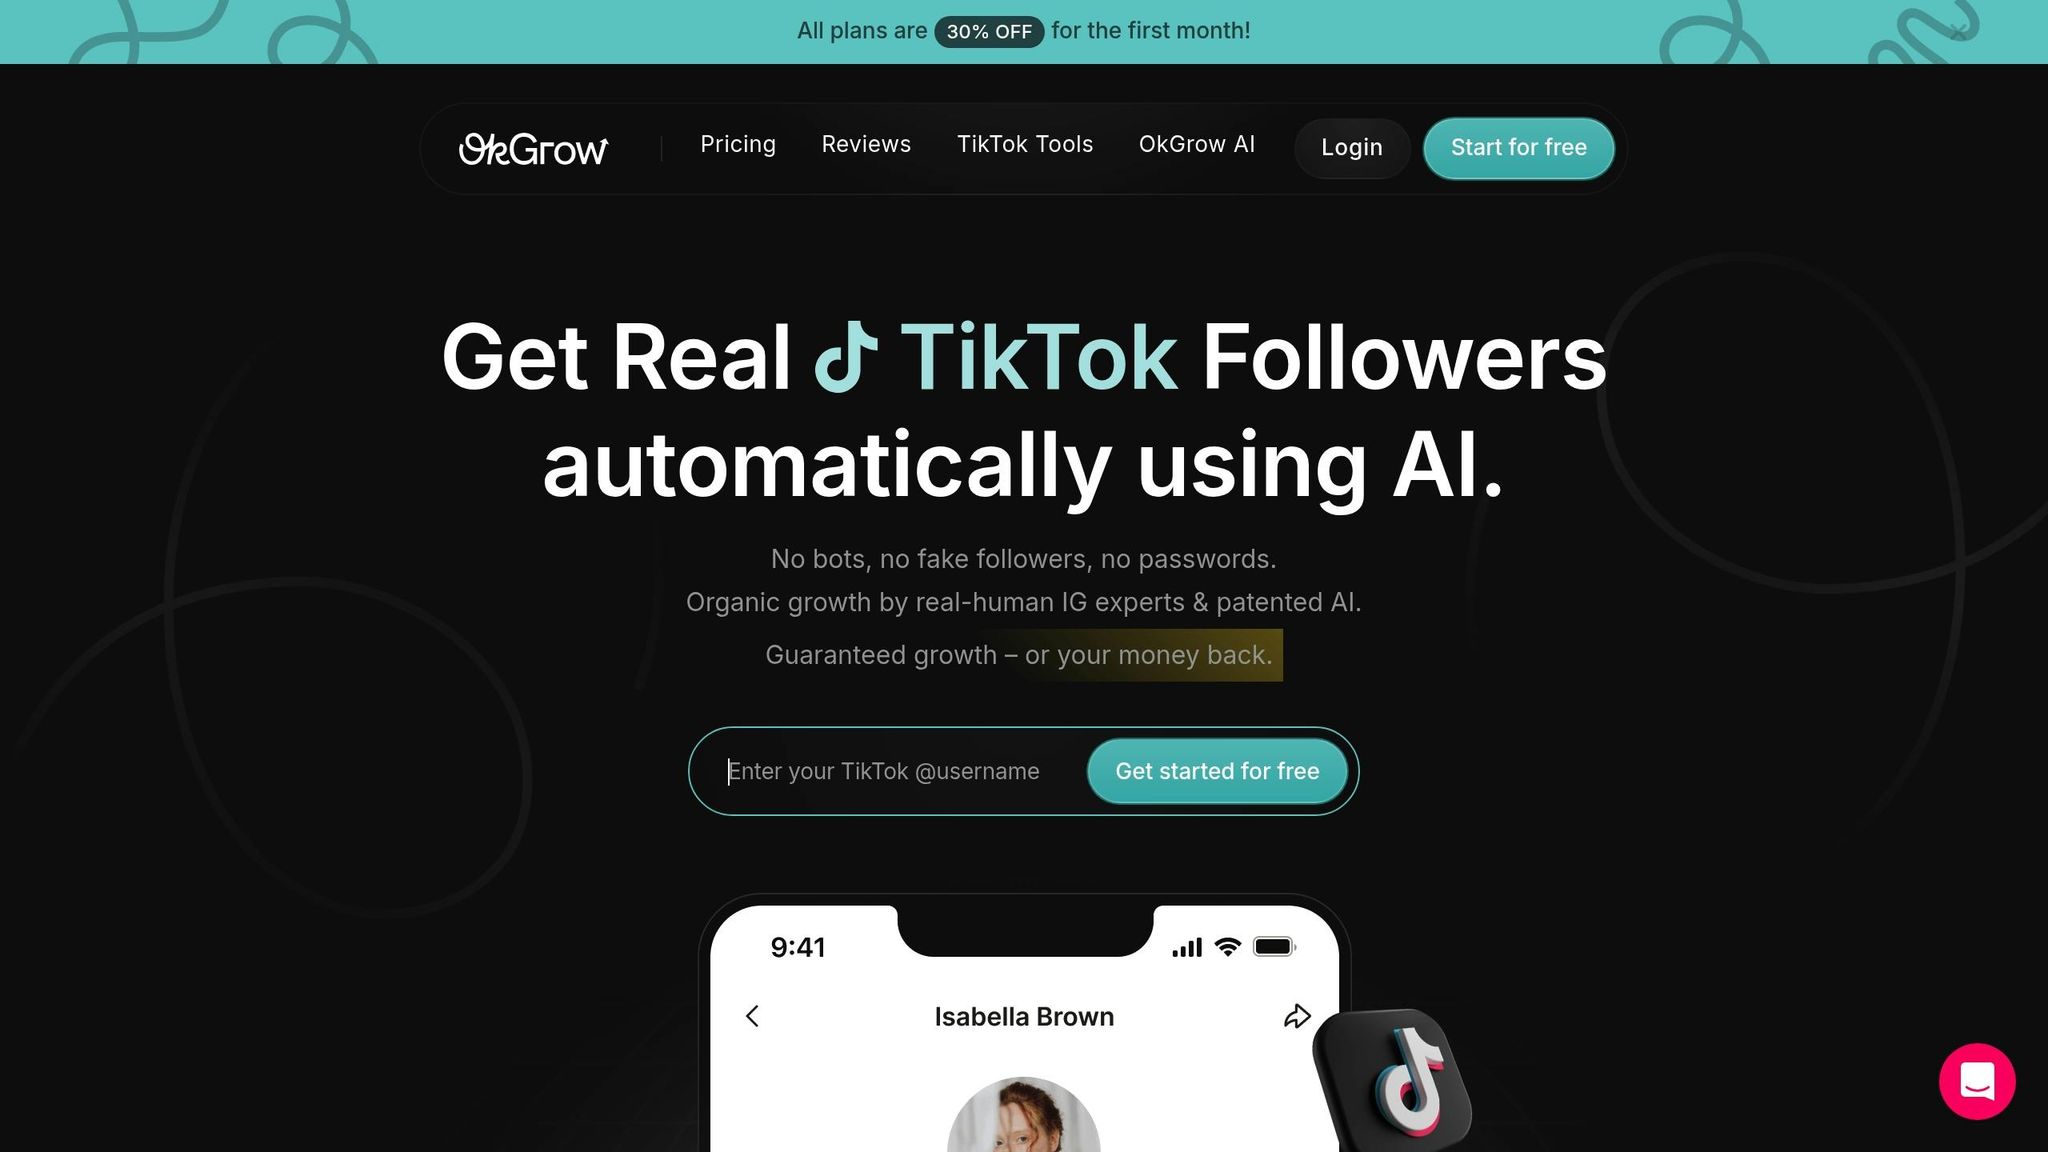
Platforms like OkGrow bring real-time analytics to the table, offering instant feedback and smarter audience targeting. They identify highly engaged users and help you zero in on niche audiences that are most likely to connect with your content.
One standout feature? AI platforms can generate PDF growth reports that simplify complex data into easy-to-understand insights. These reports cover performance trends, audience demographics, and tailored recommendations for improvement. With 55,000+ TikTokers, agencies, and businesses trusting OkGrow, and over 100,000 TikTok users seeing faster follower growth since 2016, it’s clear the platform delivers results.
Another game-changer is OkGrow's viral content library, which uses AI to spot trending topics and successful content strategies. This helps you create videos that resonate with your audience. Plus, features like language targeting and age and gender filters allow you to fine-tune your audience segmentation - something TikTok’s native tools can’t fully achieve. These advanced capabilities bridge the gap between analytics and actionable growth strategies.
AI-powered tools don’t just report data - they connect the dots between insights and actions. Research shows that using AI analytics can lead to a 32% boost in engagement and a 27% improvement in content performance. This is because these tools predict trends and provide actionable suggestions, rather than just summarizing past performance.
For example, AI tools can identify trending sounds and user behavior patterns to ensure your content stays relevant. Videos that leverage trending sounds effectively can see up to 52% higher engagement rates. AI platforms automate this process, recommending the best posting times, hashtags, and content themes based on massive amounts of data.
But it doesn’t stop at content creation. AI tools can also handle tasks like scriptwriting, subtitling, and voiceovers, giving you more time to focus on strategy. Businesses using these tools report a 35% increase in content performance and 28% higher conversion rates, as they can act on insights more quickly than manual analysis allows.
Even TikTok recognizes the potential of AI analytics. The platform has introduced Symphony, a suite of creative AI tools that includes Symphony Assistant, Symphony Creative Studio, Symphony Avatars, and upgraded Ad Manager features.
The real power of AI lies in creating a feedback loop between your analytics and content strategy. By identifying what drives engagement and automatically optimizing for those factors, AI ensures your TikTok growth is not just faster but also more sustainable.
Turning TikTok data into actionable strategies is the key to driving growth. With 71% of TikTok users deciding whether to keep watching within the first three seconds, your analytics reporting needs to be just as sharp and impactful.
Your KPIs should align with your specific goals. While engagement rate, follower growth, and post reach are common starting points, the metrics you prioritize depend on what you’re aiming to achieve.
For example, engagement rates - often in the 6–10% range - are a strong indicator of audience interaction. Metrics like comments carry more weight than likes because they reflect deeper engagement and have a stronger influence on TikTok’s algorithm.
If your goal is brand visibility, focus on reach and awareness metrics. Views, unique views, and impressions show how far your content is spreading, while video completion rates reveal if your content keeps viewers interested beyond those all-important first three seconds.
For campaigns centered on conversions, track metrics that tie directly to business outcomes. Cost per session, click-through rates, and conversion rates can measure whether your TikTok efforts are translating into results. A great example: Mango used Spark Ads to promote their Camille Charrière x Mango collection, boosting web sessions by 533% and cutting cost per session by 83%.
It’s also helpful to balance both leading and lagging indicators based on your company’s growth stage. Leading indicators like engagement rate or video completion rate can help forecast future performance, while lagging indicators such as follower growth or conversion rates confirm the impact of your efforts.
| Metric Category | Key Metrics | Best For |
|---|---|---|
| Reach | Views, Unique Views, Impressions | Brand awareness campaigns |
| Engagement | Comments, Shares, Engagement Rate | Community building |
| Follower Growth | Follower Count, Growth Rate | Long-term audience growth |
| Video Performance | Watch Time, Completion Rate, Retention Rate | Content optimization |
Clear KPIs not only guide your strategy but also help you present data in ways that inspire action.
When presenting analytics, clarity and relevance are your best tools. Use charts, trend lines, and concise summaries to ensure your data drives decisions.
"Metrics are like a treasure map: they tell you how many people saw your ad, how many interacted, and most importantly, whether someone took a meaningful action afterward (like making a purchase, signing up, or at least remembering your brand for more than three seconds)." – Paula Moreno
Structure your reports to focus on business outcomes rather than vanity metrics. For instance, instead of simply stating, "10,000 views", explain how those views contributed to brand awareness or website traffic. Start with a high-level overview tied to your goals, then dive into specific metrics that explain the "why" behind the numbers.
Visual storytelling can make complex data easier to digest. Use trend charts to show engagement over time, comparison graphs to highlight improvements, and heat maps to identify the best posting times. Adding timeframes and percentage changes (e.g., "engagement increased by 45% in one month") helps provide context.
Every metric should lead to an actionable recommendation. If video completion rates drop by 15%, identify the cause and suggest adjustments. Backing your recommendations with examples from past campaigns or industry benchmarks strengthens your argument and builds trust.
Tailor your reporting frequency to the campaign’s pace and the stakeholders’ needs. Weekly updates might suit fast-moving campaigns, while monthly summaries work better for long-term efforts. Combining quantitative metrics with qualitative insights ensures a well-rounded view of performance.
Consistency is key when comparing metrics across campaigns or timeframes. Stick to the same calculation methods, attribution windows, and formatting.
Finally, adapt your reports to your audience. Offer executive summaries with high-level insights for senior stakeholders and detailed breakdowns for team members managing execution. Including clear next steps and resource needs makes it easier for stakeholders to act on your insights effectively.
TikTok analytics offer the tools you need to fuel growth and make informed decisions. With over 1.56 billion monthly active users spending an average of 52 minutes per day on the platform, TikTok presents an unmatched opportunity for businesses to engage with their audience.
The key to success lies in understanding your audience's demographics and behaviors, setting clear goals, and tracking essential metrics. Whether it's engagement rates, video completion times, or conversion data, every number can guide your next move.
As highlighted by Brandwatch:
"Data is central to digital marketing in 2025 – and TikTok is one of the best social platforms for launching data-guided campaigns." - Brandwatch
Brand consistency plays a major role too, with studies showing it can boost revenue by 33%. Additionally, 41% of TikTok users are more likely to support brands that bring positivity to their day. These figures emphasize the power of data-driven content strategies in capturing attention and driving results on TikTok.
To maximize your efforts, combine analytics with the right tools and expertise. Platforms like OkGrow offer AI-driven insights and real-time analytics, paired with expert account management, to help you refine your strategy.
Adaptability is key: experiment with different content styles, tweak your posting schedule based on analytics, and engage actively with your audience as trends shift. The most successful brands on TikTok are those that let analytics guide every content decision.
Start leveraging these insights today and turn your TikTok presence into a powerful business asset.
Switching to a TikTok Business Account gives you access to advanced analytics tools, offering detailed insights into your content and audience. You’ll gain access to metrics like video performance, audience demographics, engagement rates, and follower activity trends.
These analytics help you figure out what works best with your audience, so you can fine-tune your content strategy to boost growth and interaction. Plus, with the ability to track performance over time, you can make smarter, data-driven decisions to improve your TikTok presence.
AI-driven tools, such as OkGrow, take TikTok analytics to the next level by providing real-time insights into how your audience interacts with your content. From tracking engagement patterns to evaluating content performance, these tools help you better understand what works for your followers and refine your strategy accordingly.
On top of that, AI automates tasks like audience targeting and performance tracking, simplifying what would otherwise be a time-consuming process. This automation not only saves you time but also enables smarter, data-backed decisions. The result? Improved engagement, steady organic growth, and a more efficient path toward achieving your goals.
To get the best results from TikTok analytics, keep an eye on essential metrics like audience demographics, engagement rates, and video performance. These metrics give you a clearer picture of who’s watching your content, what they’re enjoying, and when they’re most active.
By analyzing this data, you can fine-tune your posting schedule, craft content that taps into trending topics, and try out formats that click with your audience. Regularly checking these insights helps you make smarter decisions to sharpen your content strategy and boost engagement.